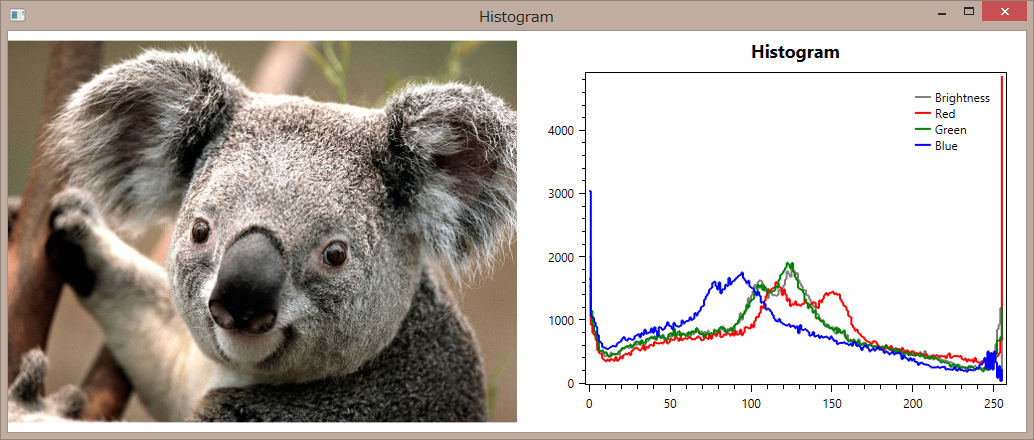
OxyPlotで画像のヒストグラム描画
OxyPlotで画像のヒストグラムのグラフを書いてみました。
画像の扱いには、以前取り上げたWriteableBitmapExを使っています。
http://d.hatena.ne.jp/minami_SC/20120927/1348698443
一応全コードは以下の通り。
MainWindow.xaml
<Window x:Class="DrawHistogram.MainWindow"
        xmlns="http://schemas.microsoft.com/winfx/2006/xaml/presentation"
        xmlns:x="http://schemas.microsoft.com/winfx/2006/xaml"
        xmlns:oxy="clr-namespace:OxyPlot.Wpf;assembly=OxyPlot.Wpf"
        xmlns:series="clr-namespace:OxyPlot.Series;assembly=OxyPlot"
        Title="Histogram" Height="400" Width="600">
    <Grid x:Name="root" Background="Transparent" AllowDrop="True" Drop="root_Drop">
        <Grid.ColumnDefinitions>
            <ColumnDefinition />
            <ColumnDefinition />
        </Grid.ColumnDefinitions>
        <Image Source="{Binding ImageSource}"/>
        <oxy:Plot x:Name="plotHistogram" Grid.Column="1" Model="{Binding Model}"/>
    </Grid>
</Window>
MainWindow.xaml.cs
using OxyPlot;
using OxyPlot.Series;
using System;
using System.Linq;
using System.Windows;
using System.Windows.Media;
using System.Windows.Media.Imaging;

namespace DrawHistogram
{
    /// <summary>
    /// MainWindow.xaml の相互作用ロジック
    /// </summary>
    public partial class MainWindow : Window
    {
        private string[] _supportExts = { ".bmp", ".jpg", ".jpeg", ".png", ".tif", ".tiff" };
        /// <summary>
        /// 読み込み可能な拡張子リスト
        /// </summary>
        public string[] SupportExts
        {
            get { return _supportExts; }
        }

        public PlotModel Model { get; set; }

        /// <summary>
        /// 表示する画像を取得または設定します
        /// </summary>
        public WriteableBitmap ImageSource
        {
            get { return (WriteableBitmap)GetValue(ImageSourceProperty); }
            set { SetValue(ImageSourceProperty, value); }
        }
        // Using a DependencyProperty as the backing store for ImageSource.  This enables animation, styling, binding, etc...
        public static readonly DependencyProperty ImageSourceProperty =
            DependencyProperty.Register("ImageSource", typeof(WriteableBitmap), typeof(MainWindow), new PropertyMetadata(null));


        public MainWindow()
        {
            InitializeComponent();
            this.DataContext = this;

            Model = new PlotModel("Histogram");
            //CalcHistogram();
        }

        private void root_Drop(object sender, DragEventArgs e)
        {
            string[] files = e.Data.GetData(DataFormats.FileDrop) as string[];
            if (files == null) return;

            string filename = files[0].ToLower();
            string ext = System.IO.Path.GetExtension(filename);
            if (SupportExts.Any(s => s == ext))
            {
                var img = new BitmapImage(new Uri(filename, UriKind.Absolute));
                ImageSource = BitmapFactory.ConvertToPbgra32Format(img);
                CalcHistogram();
            }
        }

        private void CalcHistogram()
        {
            // ヒストグラムの計算
            int width = ImageSource.PixelWidth;
            int height = ImageSource.PixelHeight;
            var histogramV = new int[256];
            var histogramR = new int[256];
            var histogramG = new int[256];
            var histogramB = new int[256];
            for (int y = 0; y < height; y++)
            {
                for (int x = 0; x < width; x++)
                {
                    byte v = ImageSource.GetBrightness(x, y);
                    var col = ImageSource.GetPixel(x, y);
                    histogramV[v]++;
                    histogramR[col.R]++;
                    histogramG[col.G]++;
                    histogramB[col.B]++;
                }
            }

            // グラフの作成
            var seriesV = new StairStepSeries("Brightness")
            {
                Color = OxyColors.Gray,
                VerticalLineStyle = LineStyle.None,
                MarkerType = MarkerType.None
            };
            var seriesR = new StairStepSeries("Red")
            {
                Color = OxyColors.Red,
                VerticalLineStyle = LineStyle.None,
                MarkerType = MarkerType.None
            };
            var seriesG = new StairStepSeries("Green")
            {
                Color = OxyColors.Green,
                VerticalLineStyle = LineStyle.None,
                MarkerType = MarkerType.None
            };
            var seriesB = new StairStepSeries("Blue")
            {
                Color = OxyColors.Blue,
                VerticalLineStyle = LineStyle.None,
                MarkerType = MarkerType.None
            };

            for (int x = 0; x < 256; x++)
            {
                seriesV.Points.Add(new DataPoint(x, histogramV[x]));
                seriesR.Points.Add(new DataPoint(x, histogramR[x]));
                seriesG.Points.Add(new DataPoint(x, histogramG[x]));
                seriesB.Points.Add(new DataPoint(x, histogramB[x]));
            }

            Model.Series.Clear();
            Model.Series.Add(seriesV);
            Model.Series.Add(seriesR);
            Model.Series.Add(seriesG);
            Model.Series.Add(seriesB);

            Model.InvalidatePlot(true);
        }
    }
}
